What a Week

This has been an incredible week (15 trading days to be precise). The SPY is down 20% and the futures are currently locked limit down for the open tomorrow. Volatility has been breathtaking with overnight futures locked both limit up and limit down and circuit breakers during the day being hit twice.

Oh, and now our cities are going to look like scenes from the Walking Dead. Great.

Obviously, COVID-19 has been the primary catalyst for this but an oil price war certainly hasn’t helped – I know it feels like a long time ago but it was just last Monday that oil dropped 30% in one day.

I’d like to tell you that my systems reacted perfectly and everything is smooth sailing. But I can’t – After a nearly 40% return last year, my primary system is in a 23% drawdown. Its not fun. I guess the positive is that now I know I can actually handle a drawdown that large. It’s one thing to say you can handle a certain amount of volatility but it’s quite another to live through it.

As many of you know, my primary system right now is a “buy the dip” mean reversion type, I’ve gone back again to see how it performed in previous large market drops. In general while it still experienced a drawdown it was muted compared to the overall market. I think the reason it hasn’t performed as well this time is just the shear velocity of this move. In the others there were several periods of drops and then some up or sideways activity where the exit signals were triggered. Haven’t seen that much in this move.

So what now? In my specific case I’m going to trade the signals as they come. At least until a 25% drawdown on a closing basis. At that point I’ll execute a stop on the system and take it down. I’ve also been throwing on a few call credit spreads in the SPY just to hedge the downside a bit. I do think we’ll stabilize and return to a more normal market dynamic but I have no idea when that will be.

The best advise I can give anyone in this market is if you can be on the sidelines in cash, that is probably the best place to be. You may miss out on the initial rally back but there may be substantially more downside before that happens.
The Importance of Limiting Drawdowns

In my last post I mentioned that for most systems I don’t want to experience greater than around a 20% drawdown. The main reason for that is I tend to get more emotionally involved at that point than I should. This is the point where I would start to think I should ignore my systems and start to go with some gut decisions (never a good idea).

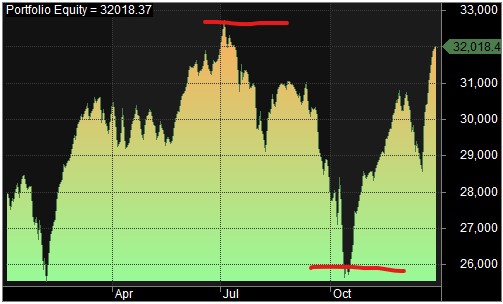
But there’s a mathematical reason for limiting drawdowns to 20% or less as well. First let’s define what drawdown is: the drop in account equity relative to the highest equity achieved prior to the drawdown.

In this example there’s almost a 20% drop from the peak of the equity in July to the trough in October. Unfortunately as the next chart shows there is not a symmetric relationship between the loss and the gain required to recover from it:

Drawdown PercentRecovery Percent
55.3
1011.1
1517.6
2025
2533.3
3042.9
3553.8
4066.7
4581.8
50100
55122
60150

So to recover from that 20% drawdown requires a gain of 25%. That’s not an unreasonable amount but it’s still probably going to take a while. As you increase the drawdown the amount to recover increases more. At a 40% drawdown (not unusual for many trend following systems) you’ll need to gain 66% just to get to breakeven. That’s hard to stomach (for me anyway).

The more you can limit drawdown the less volatile your system will be and the less it will actually need to make to increase your equity. Of course every system is going to have some drawdown – There has to be some risk for the reward. But smaller is almost always better.

Drawdowns and Emotions

This has been a most interesting time for trading these last few weeks. Volatility has definitely returned to the stock markets. I want to use this to highlight some things that traders and particularly system traders fall into.

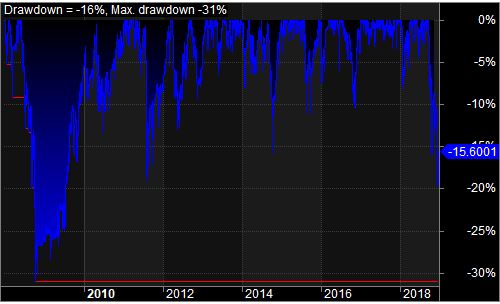
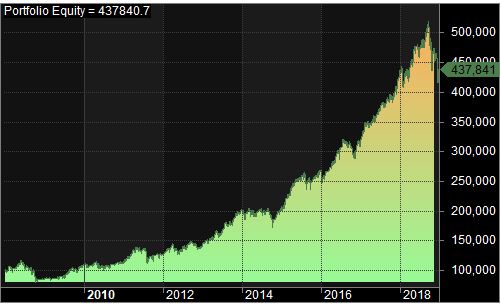
I’m going to use one of my swing trading systems as an example. Below are the equity and drawdown curves over the last 10 years. As you can see it has a decent equity curve and it returns about 14% a year CAGR. Not bad but certainly not fantastic. Now I realize this is just one possible curve for this system. For systems like this one that generate a lot of short trades I prefer to use Monte Carlo analysis to generate a distribution of possible curves, but more on that in a later post.

One of the weaknesses of this type of system is it tends to load up right before a big downturn. It’s a “buy the dip” type of strategy and everything dips right before the bottom falls out. So I’m currently sitting in a 16% drawdown and let me tell you, it’s not fun – I don’t like it. It’s one thing to look at an equity chart and say, “hmm, well there are some downturns here and there”. It’s quite another to watch your account bleeding money for several days or weeks.

If you look at the two curves you’ll see that the maximum drawdown was 31% during the 2008 crash. Looking at the equity curve over there, it doesn’t look that bad does it? Just a little dip in the equity that’s all. Thirty percent is a lot to watch flying out of your account. With the hypothetical $100,000 account that we started with that’s $30,000 gone. There are also quite a few flat areas where it didn’t do much. Look at the beginning of 2014 – There’s not much happening for several months. That’s hard to deal with too.

My point with this is it’s not enough to just look at backtest or walk forward results and say “Yep, I can trade that no problem”. You really need to look at what’s happening on a month by month basis and think through whether or not you really could trade that. Many financial planners or services will take you through some sort of risk assessment to determine how much risk tolerance you have I think most of the time people overestimate their tolerance. Twenty percent is about all I want to handle (there’s a mathematical reason for that as well, again I’ll cover that in a later post) but that’s because I’ve been through it before. Most people get squeamish well before then.

Two books I highly recommend for system traders are Following the Trend and Stocks on the Move both by Andreas Clenow. He takes you through the fundamentals of trend following systems for commodities in the first book and a rotational system in the second. But what’s really great about these is he takes you through each backtest as it would have traded at the time. It’s a much different perspective than just looking at the charts.

If you have a lower tolerance for risk, that’s ok. Just make sure you incorporate an amount of risk that you can actually handle when designing your systems.

Ouch

Wow, it’s been an interesting couple of weeks.

My options trading account is about breakeven for the year. My automated swing trading system is down about 13% for the month and 7% for the year. I really hate drawdowns, especially after just hitting an equity high. But that’s how this stuff works. The swing system historically has drawdowns as high as 20% so we’re not that close yet. If we keep going down then I might need to reevaluate but until then, I’ll just keep taking the signals and trading as usual.