This has been a most interesting time for trading these last few weeks. Volatility has definitely returned to the stock markets. I want to use this to highlight some things that traders and particularly system traders fall into.
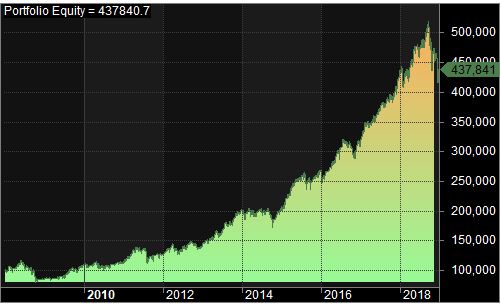
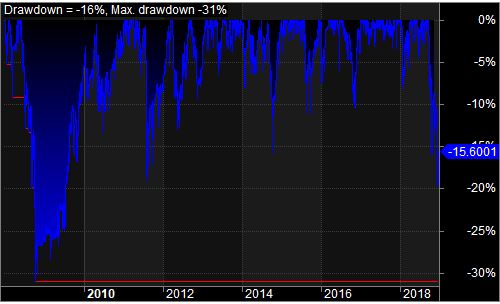
I’m going to use one of my swing trading systems as an example. Below are the equity and drawdown curves over the last 10 years. As you can see it has a decent equity curve and it returns about 14% a year CAGR. Not bad but certainly not fantastic. Now I realize this is just one possible curve for this system. For systems like this one that generate a lot of short trades I prefer to use Monte Carlo analysis to generate a distribution of possible curves, but more on that in a later post.
One of the weaknesses of this type of system is it tends to load up right before a big downturn. It’s a “buy the dip” type of strategy and everything dips right before the bottom falls out. So I’m currently sitting in a 16% drawdown and let me tell you, it’s not fun – I don’t like it. It’s one thing to look at an equity chart and say, “hmm, well there are some downturns here and there”. It’s quite another to watch your account bleeding money for several days or weeks.
If you look at the two curves you’ll see that the maximum drawdown was 31% during the 2008 crash. Looking at the equity curve over there, it doesn’t look that bad does it? Just a little dip in the equity that’s all. Thirty percent is a lot to watch flying out of your account. With the hypothetical $100,000 account that we started with that’s $30,000 gone. There are also quite a few flat areas where it didn’t do much. Look at the beginning of 2014 – There’s not much happening for several months. That’s hard to deal with too.


My point with this is it’s not enough to just look at backtest or walk forward results and say “Yep, I can trade that no problem”. You really need to look at what’s happening on a month by month basis and think through whether or not you really could trade that. Many financial planners or services will take you through some sort of risk assessment to determine how much risk tolerance you have I think most of the time people overestimate their tolerance. Twenty percent is about all I want to handle (there’s a mathematical reason for that as well, again I’ll cover that in a later post) but that’s because I’ve been through it before. Most people get squeamish well before then.
Two books I highly recommend for system traders are Following the Trend and Stocks on the Move both by Andreas Clenow. He takes you through the fundamentals of trend following systems for commodities in the first book and a rotational system in the second. But what’s really great about these is he takes you through each backtest as it would have traded at the time. It’s a much different perspective than just looking at the charts.
If you have a lower tolerance for risk, that’s ok. Just make sure you incorporate an amount of risk that you can actually handle when designing your systems.